The Lipid Interactome
Overview
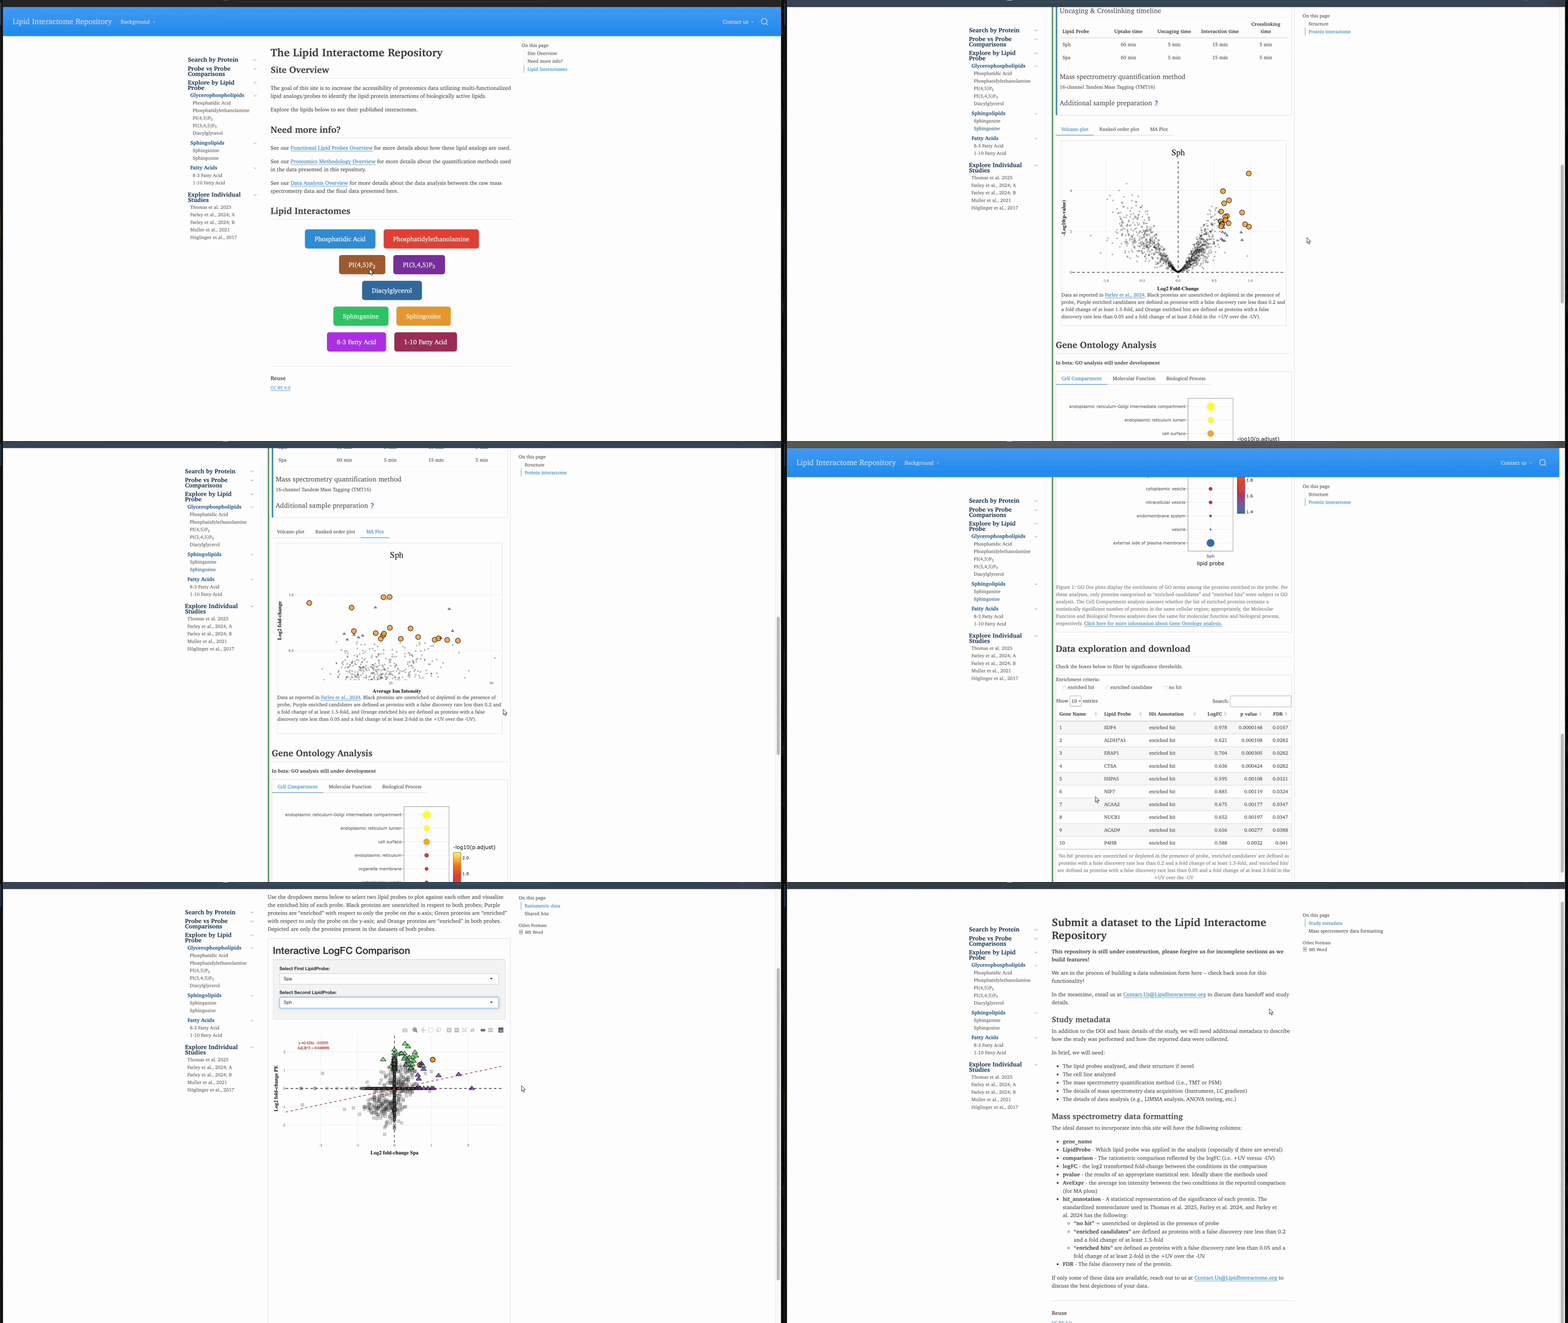
The Lipid Interactome is an interactive, centralized resource designed to harmonize, compare, and integrate lipid interactome datasets. It adheres to FAIR (Findable, Accessible, Interoperable, and Reusable) data principles, ensuring that lipid–protein interaction data is systematically organized and easily accessible to researchers. By consolidating proteomics data from multifunctional lipid probes, this resource facilitates the systematic study of lipid-binding proteins across different lipid species and cellular models.
I built this repository with the guidance of Dr. Fikadu Tafesse and Dr. Carsten Schultz in order to make these data more accessible and reusable – hopefully it can help lipid researchers select candidate proteins for analyzing the functional roles of lipids.
Click here to visit the Lipid Interactome: LipidInteractome.org
Site structure
The Lipid Interactome was built using Quarto, is stored on GitHub, and hosted on Netlify – I apparently have a pretty predictable strategy for building and hosting sites.
Data presentation/organization
Because several of the studies we’ve included on the site so far have used multiple lipid probes, we decided to split the site into two parts: pages displaying the entire dataset of each individual interactomics study and pages for each lipid probe (with datasets further separated by cell type analyzed). I thought this was valuable because some of the datasets are inherently more comparable – for example, the PA and PE data were collected together as parts of a single larger TMT experiment, as reported by Thomas et al. in 2025.
Un-rigorous comparisons
While it isn’t advisable to directly and quantitatively compare datasets collected from different studies, we wanted a way to qualitatively compare different datasets to see broad trends: Are there big overlaps in protein ids? Are the highly enriched proteins in one dataset also enriched in another? To do this, I built a nifty little comparison tool using Shiny which allows the user to select two lipid probes of interest and visualize the log2 fold-change of all proteins identified in each dataset. The cell background of each probe dataset is listed in the user selection to prepare for a future where we have datasets of the same lipid probe but different cell lines.
Data storage
This is a work in progress. I’ve been somewhat careful to describe this site as a data repository or a data aggregation site – because I definitely don’t think this site qualifies as a database just yet. Right now, each page consists of a static HTML page defined by a manually-written Quarto document, which pulls from a folder of .csv files to render the visualizations and allow for user download.
I would like to eventually get this site closer to a true database, where users are inputting queries for which lipid probe to visualize and under the hood the site pulls the data and renders the page. I don’t think my manual annotation method will work in the future we’re imagining – where there may be a rapid increase in this type of study!
Data submission
In anticipation of a broadened interest in this type of study, we supply a data submission page – this somewhat relies on the data supplier having ratiometric data that aligns with some of my data formatting requirements. These requirements were originally written when I only had a handful of datasets and they all came from the same data pipeline – so all my standardized plotting functions rely on common column headers and data transformations.
I’ve already repeatedly needed to find my own paths for data wrangling on new datasets that don’t fit neatly in my standardized plotting functions/visualization schemes. For example, Höglinger et al. (2017) used peptide spectral counts to determine selective enrichment to one of three lipid probes – there’s no ratiometric data here! And I can’t really figure out a nice way to present these results alongside ratiometric data…
